A score out of 10 for the quality of a job
We built the Tanalah Monitoring platform. It takes surveys of workers collected in the field and turns them into scores by criterion, by dimension and overall, which can be filtered, compared between groups and exported.
Tanalah, based in Bordeaux, measures job quality in developing countries with a method built on the ILO's decent work agenda. Its teams survey employees, self-employed and informal workers in the field. We built the platform that takes in those surveys and turns them into a score out of 10 by criterion, by dimension and overall, with filters, profile and survey comparisons, and exports. The screens on this page use demo data.
- Client
- Tanalah · Job quality
- Sector
- International development · employment
- Where
- Bordeaux, France
- Deliverables
- Versioned scoring engine
- Results dashboard with filters
- Profile and survey comparison
- Country reference data
- Interface in 3 languages
A research method that had to become a tool
Tanalah's method draws on the job-quality literature and boils it down to 6 dimensions: income, material conditions, working time, social protection, voice and representation, and satisfaction. Around 30 core questions, asked in about 30 minutes, work for a formal employee as well as an informal trader or a self-employed worker. Surveys run on KoboToolbox, which works offline in areas with poor coverage.
In 2023 the method lived in an Excel workbook: a repertoire of indicators with criteria, thresholds and calculation rules. Tanalah needed its clients (HR teams, funders) to see each survey's results without going through an analyst, and to compare them across groups, years and countries.
From questionnaire to score
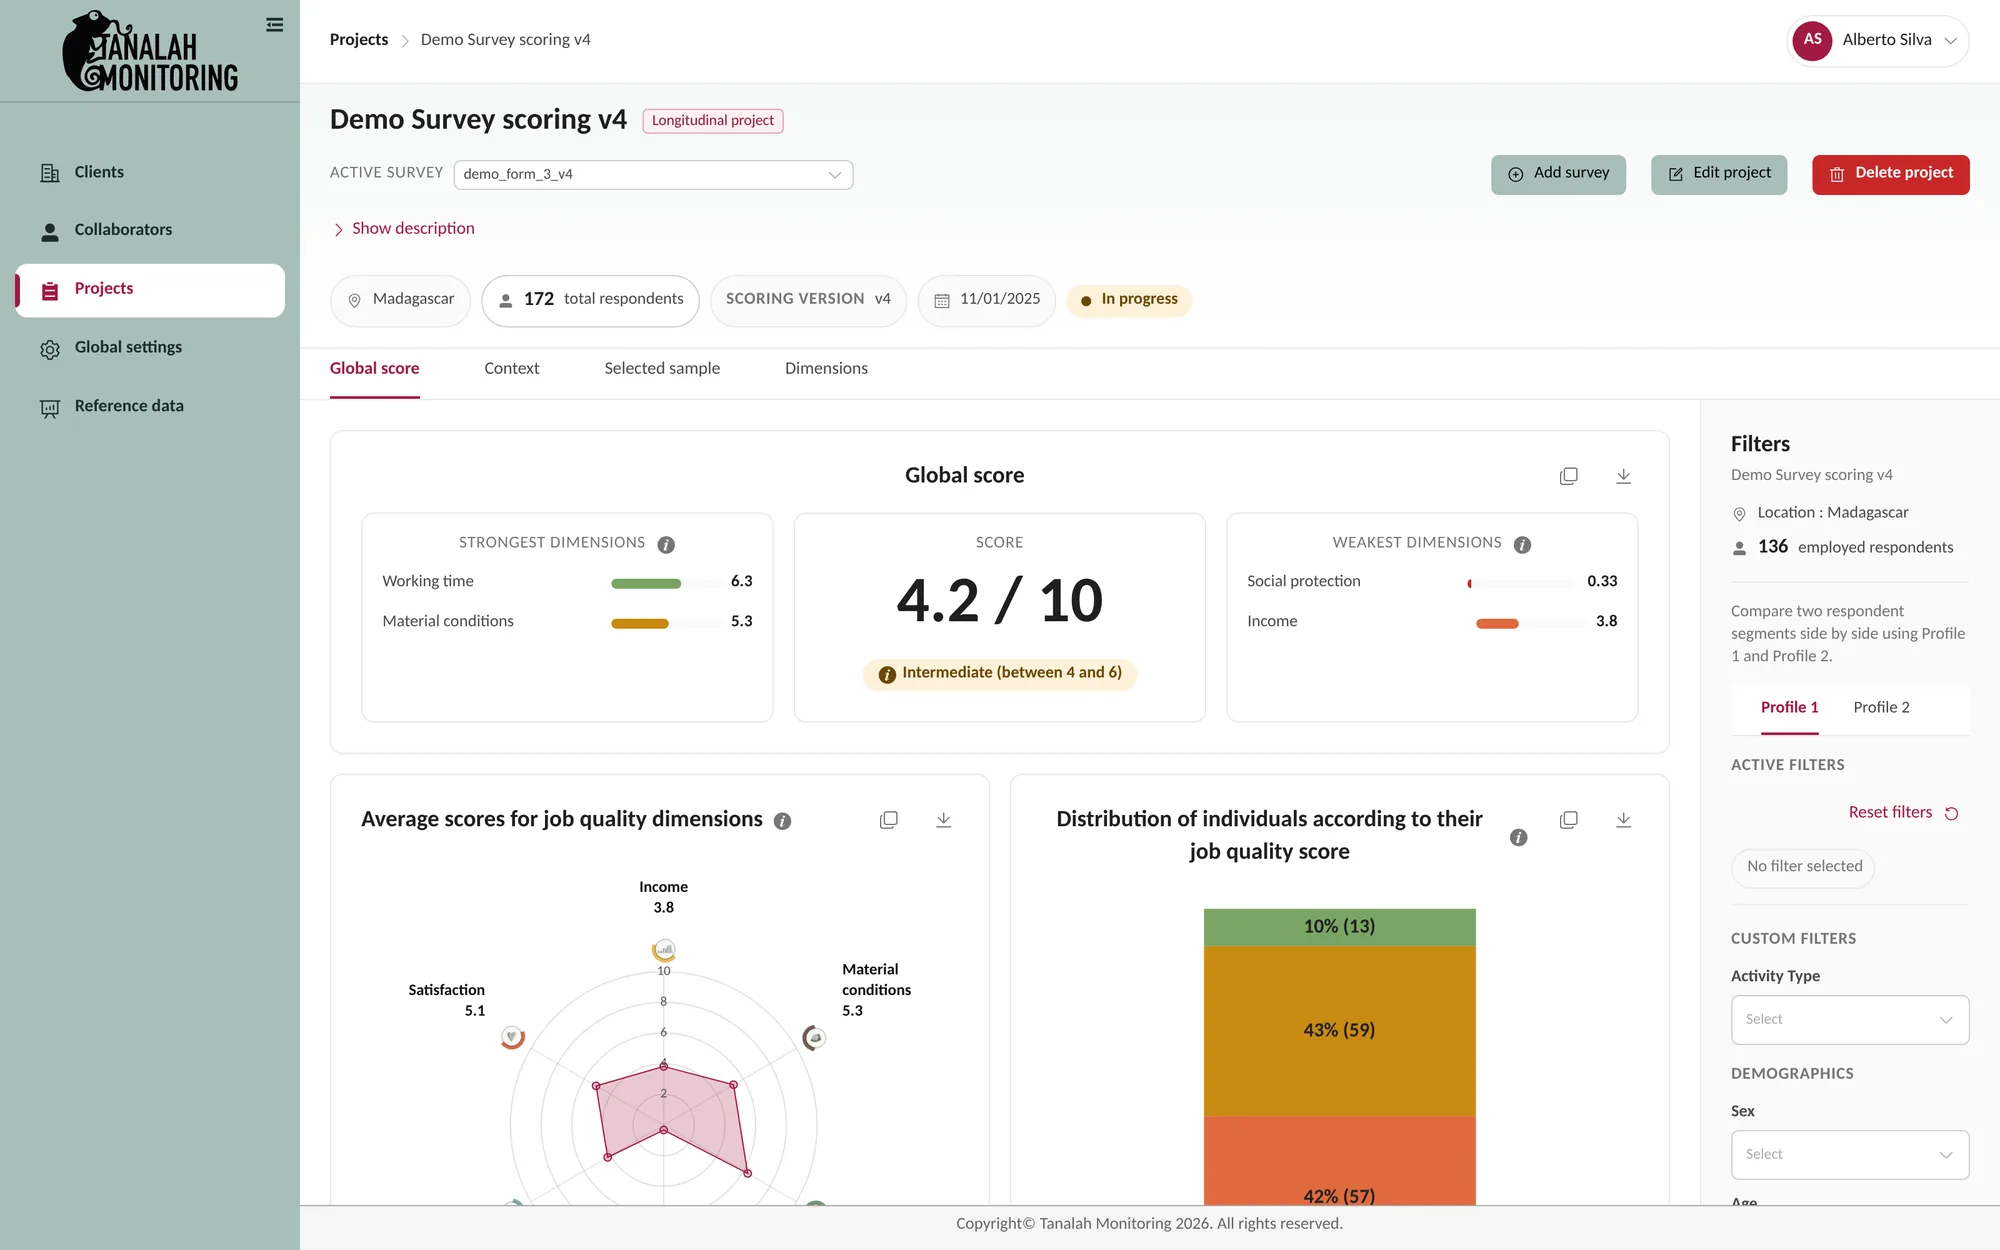
Every answer is scored criterion by criterion, out of 10. Criteria roll up into the 6 dimensions and those into an overall score, with five levels from “very low” (under 2) to “very good” (over 8). Some criteria are measured against the country's law: the median salary is compared with the legal minimum wage, agricultural or for other sectors. Each survey keeps the scoring version it was calculated with, so a change of method does not rewrite past results.
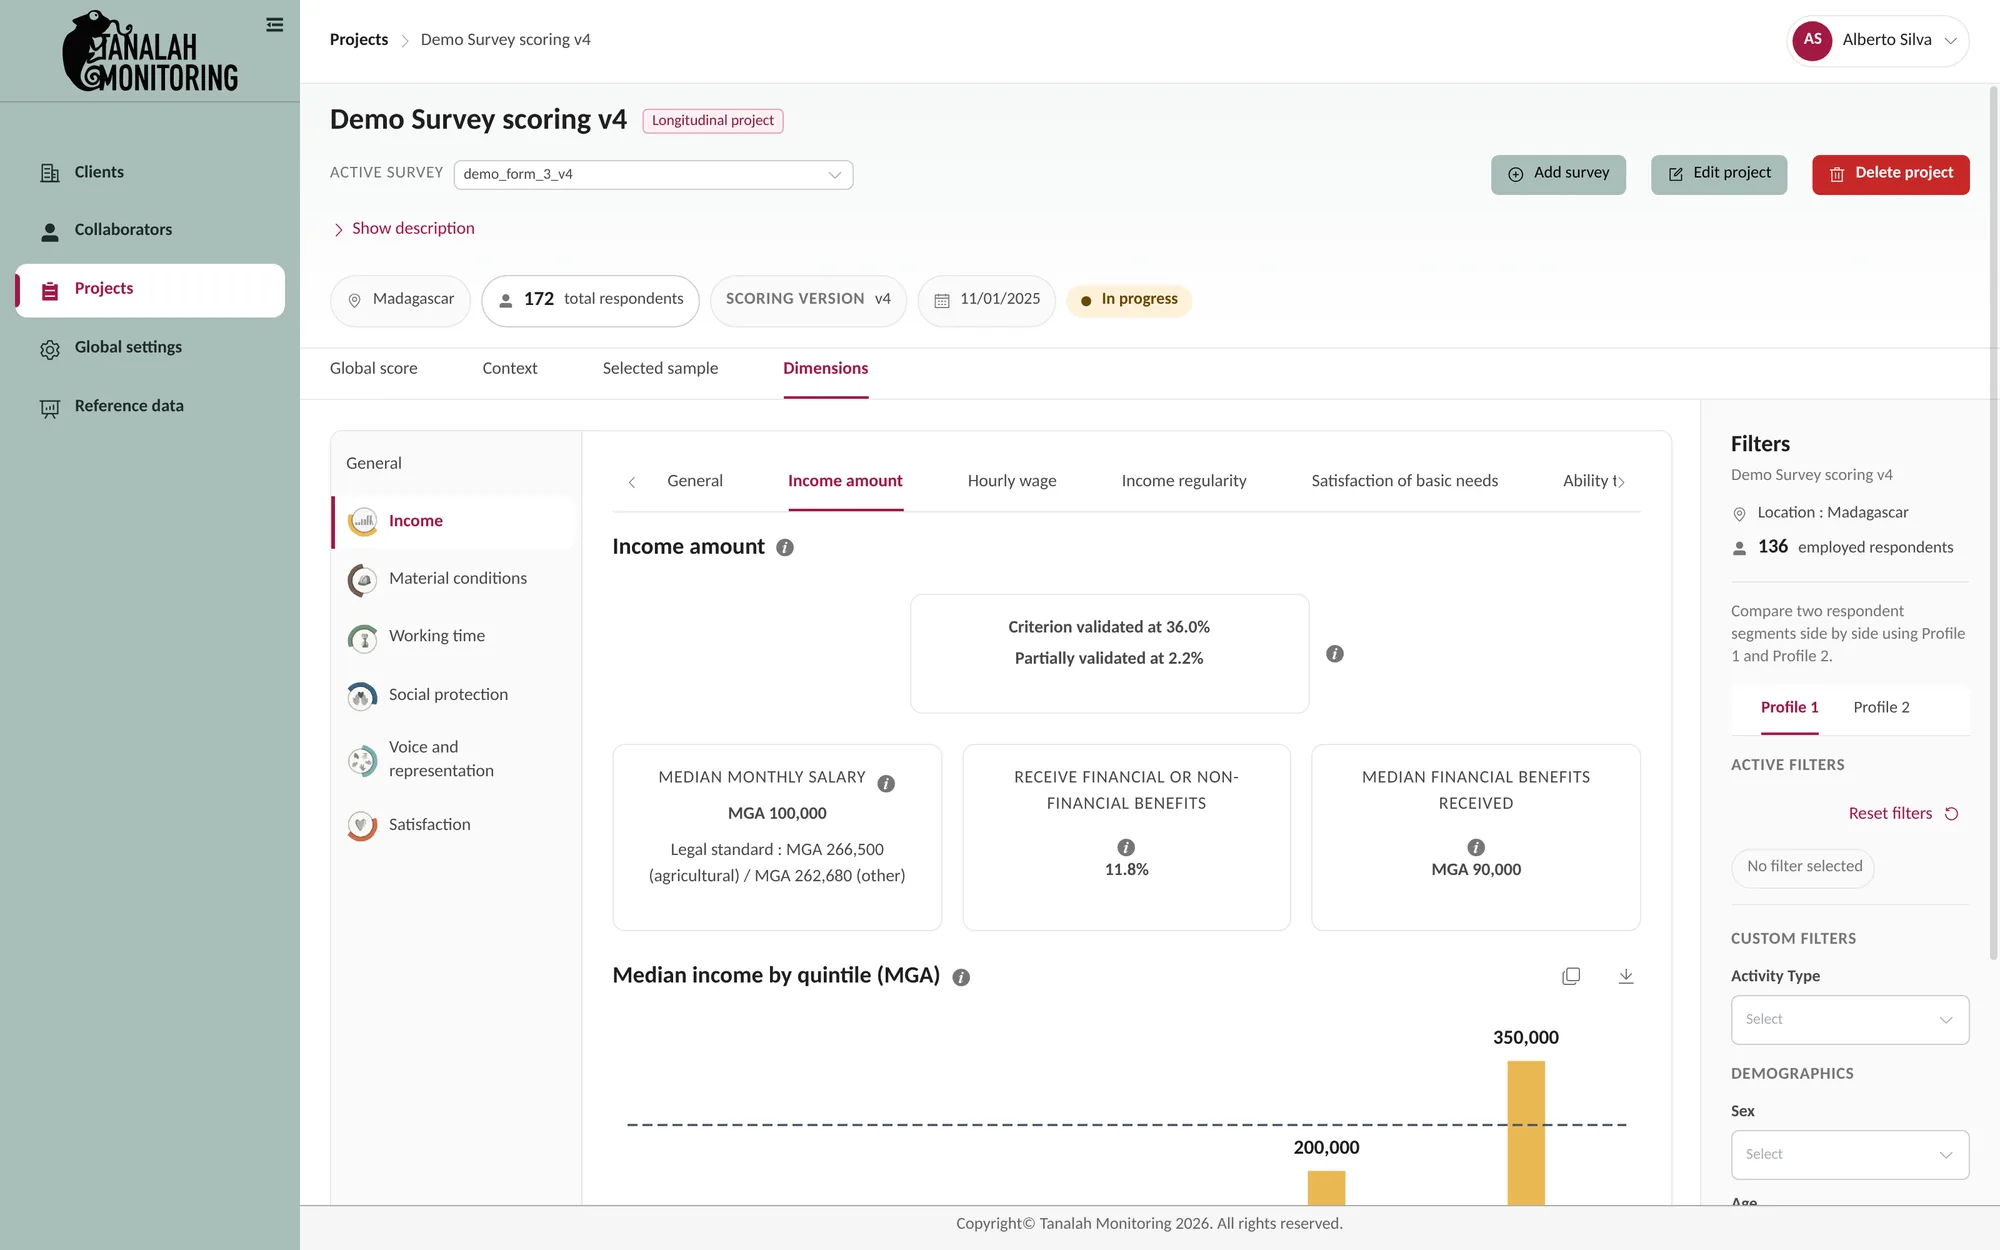
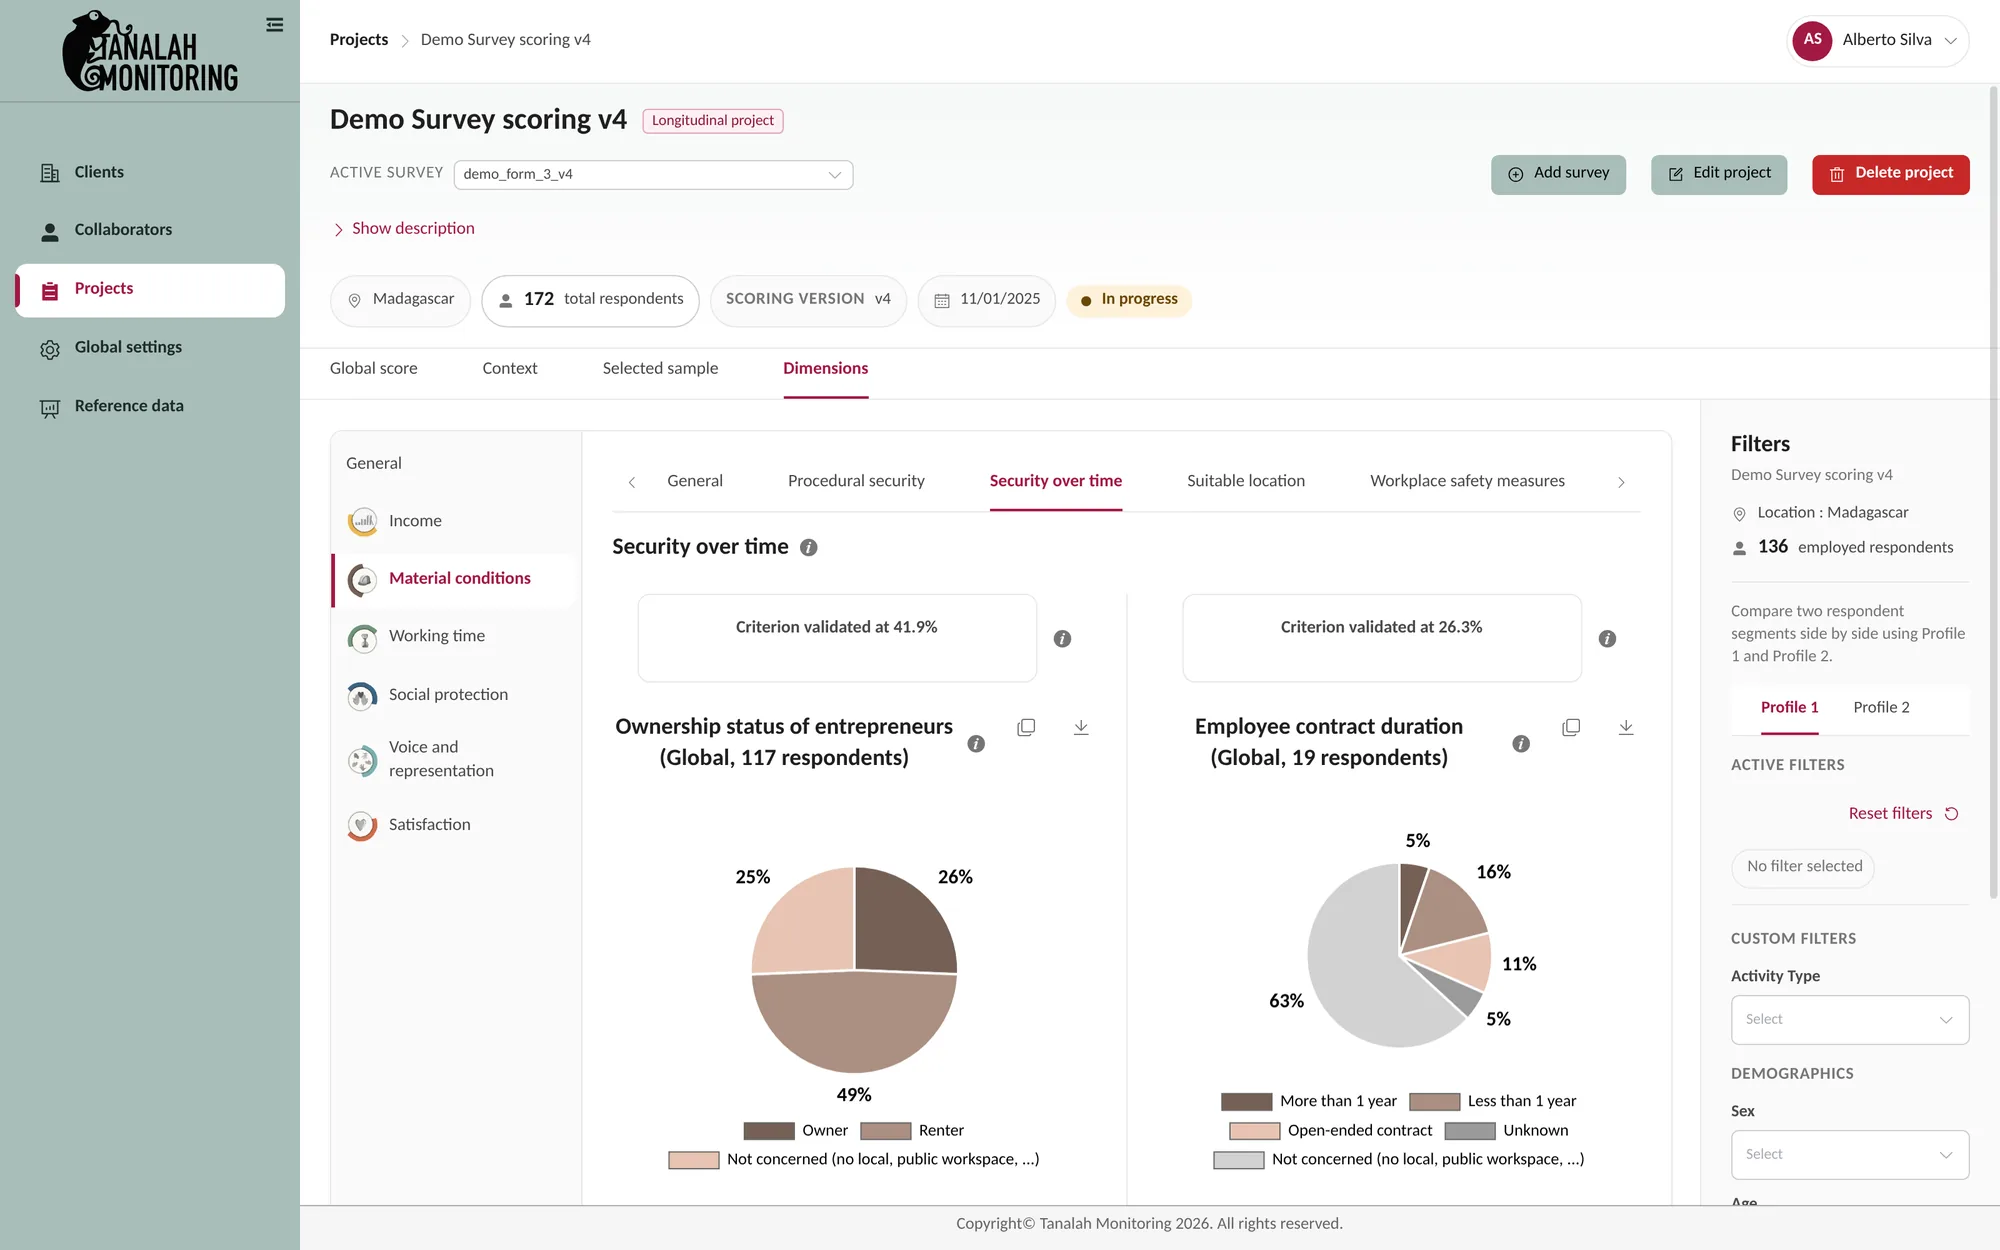
A project dashboard has four tabs. Global score, with the strongest and weakest dimensions and how respondents spread across levels. Context, with the country's national indicators. Selected sample, with the profile of the people who answered. Dimensions, with every criterion in detail. On the right, filters by sex, age, education, region or activity type, and two profiles compared side by side: men and women, for example.
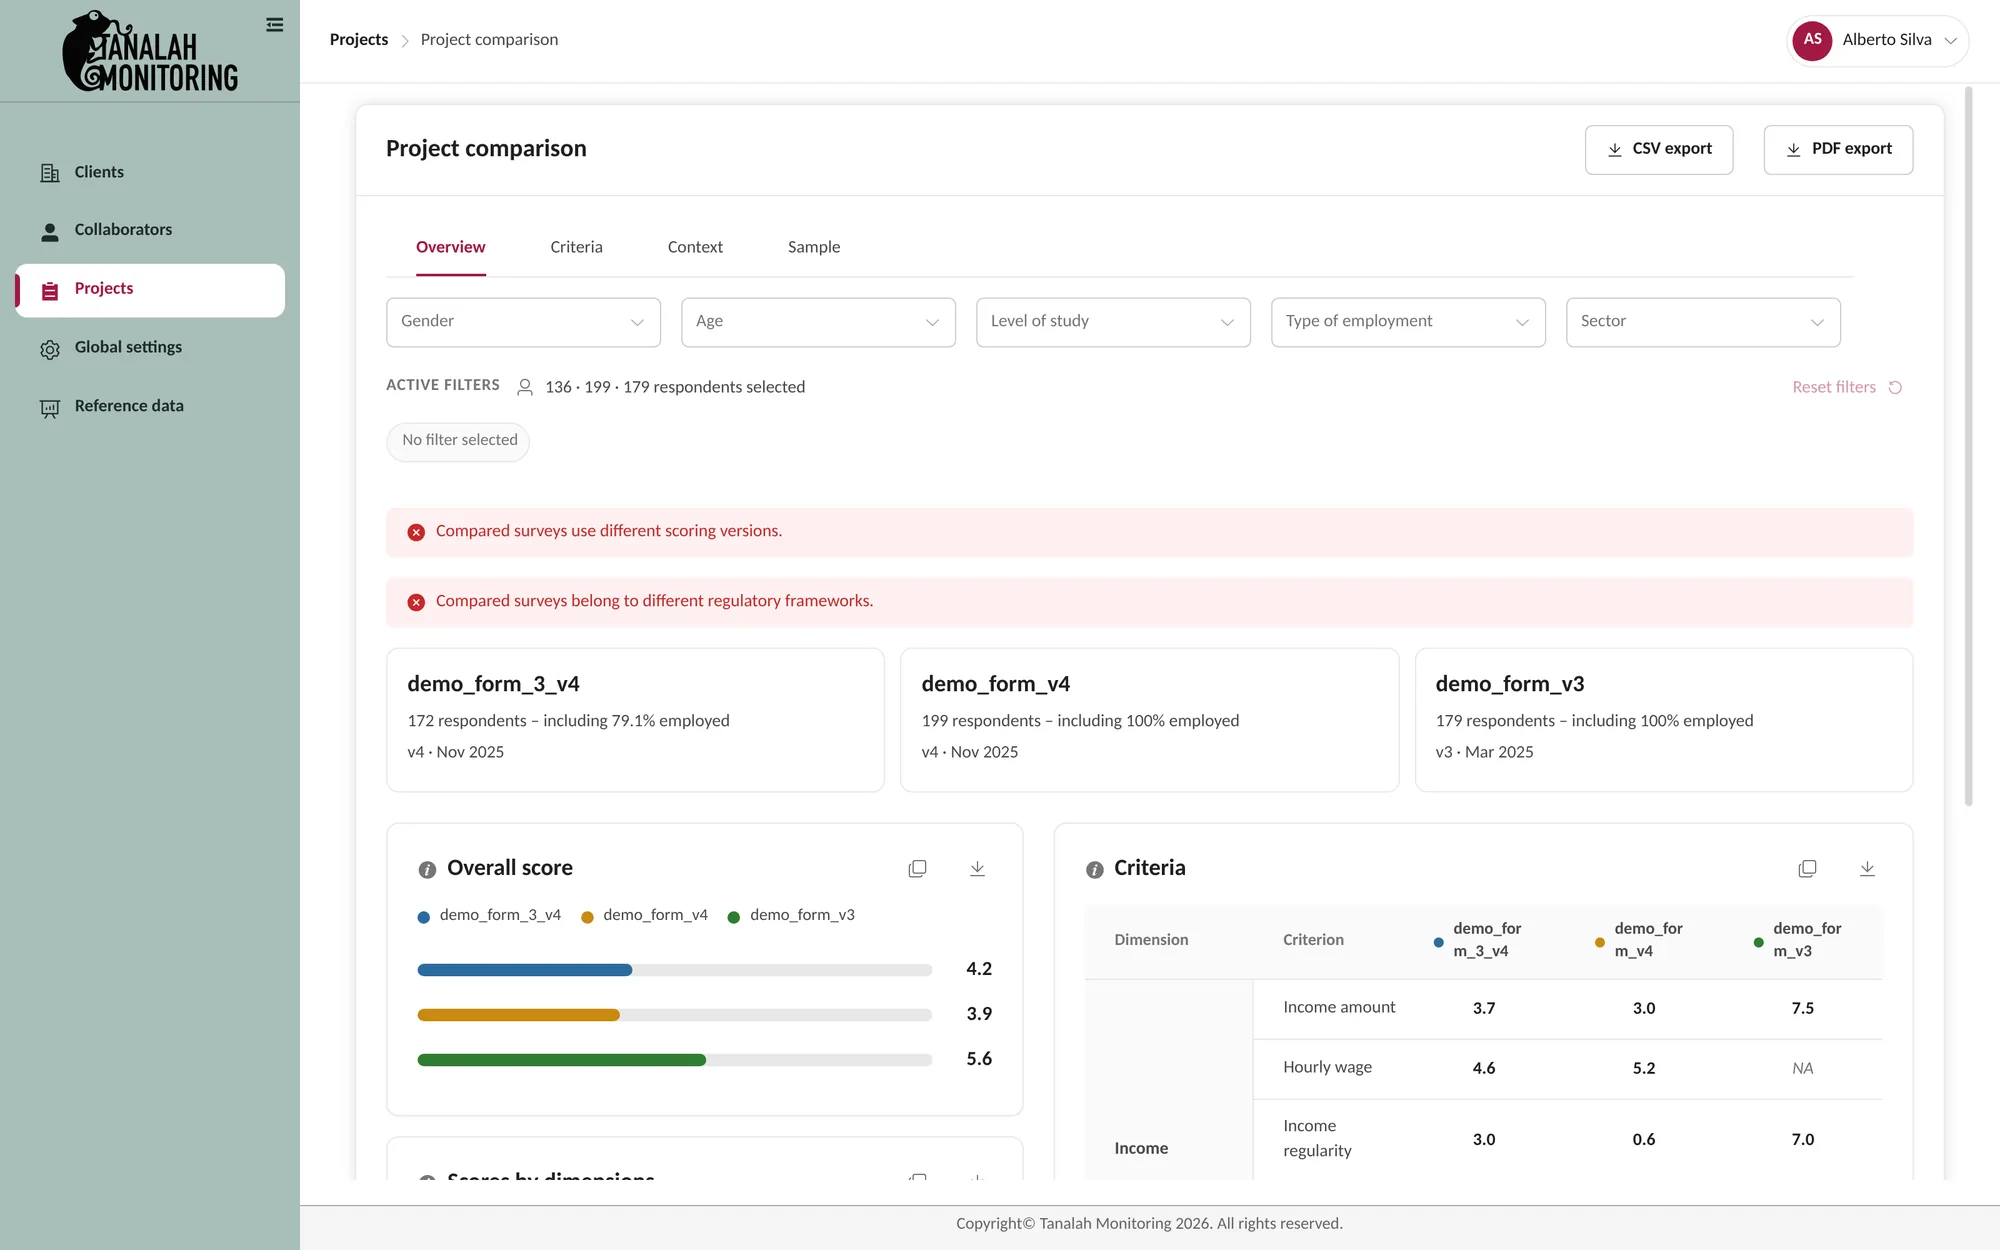
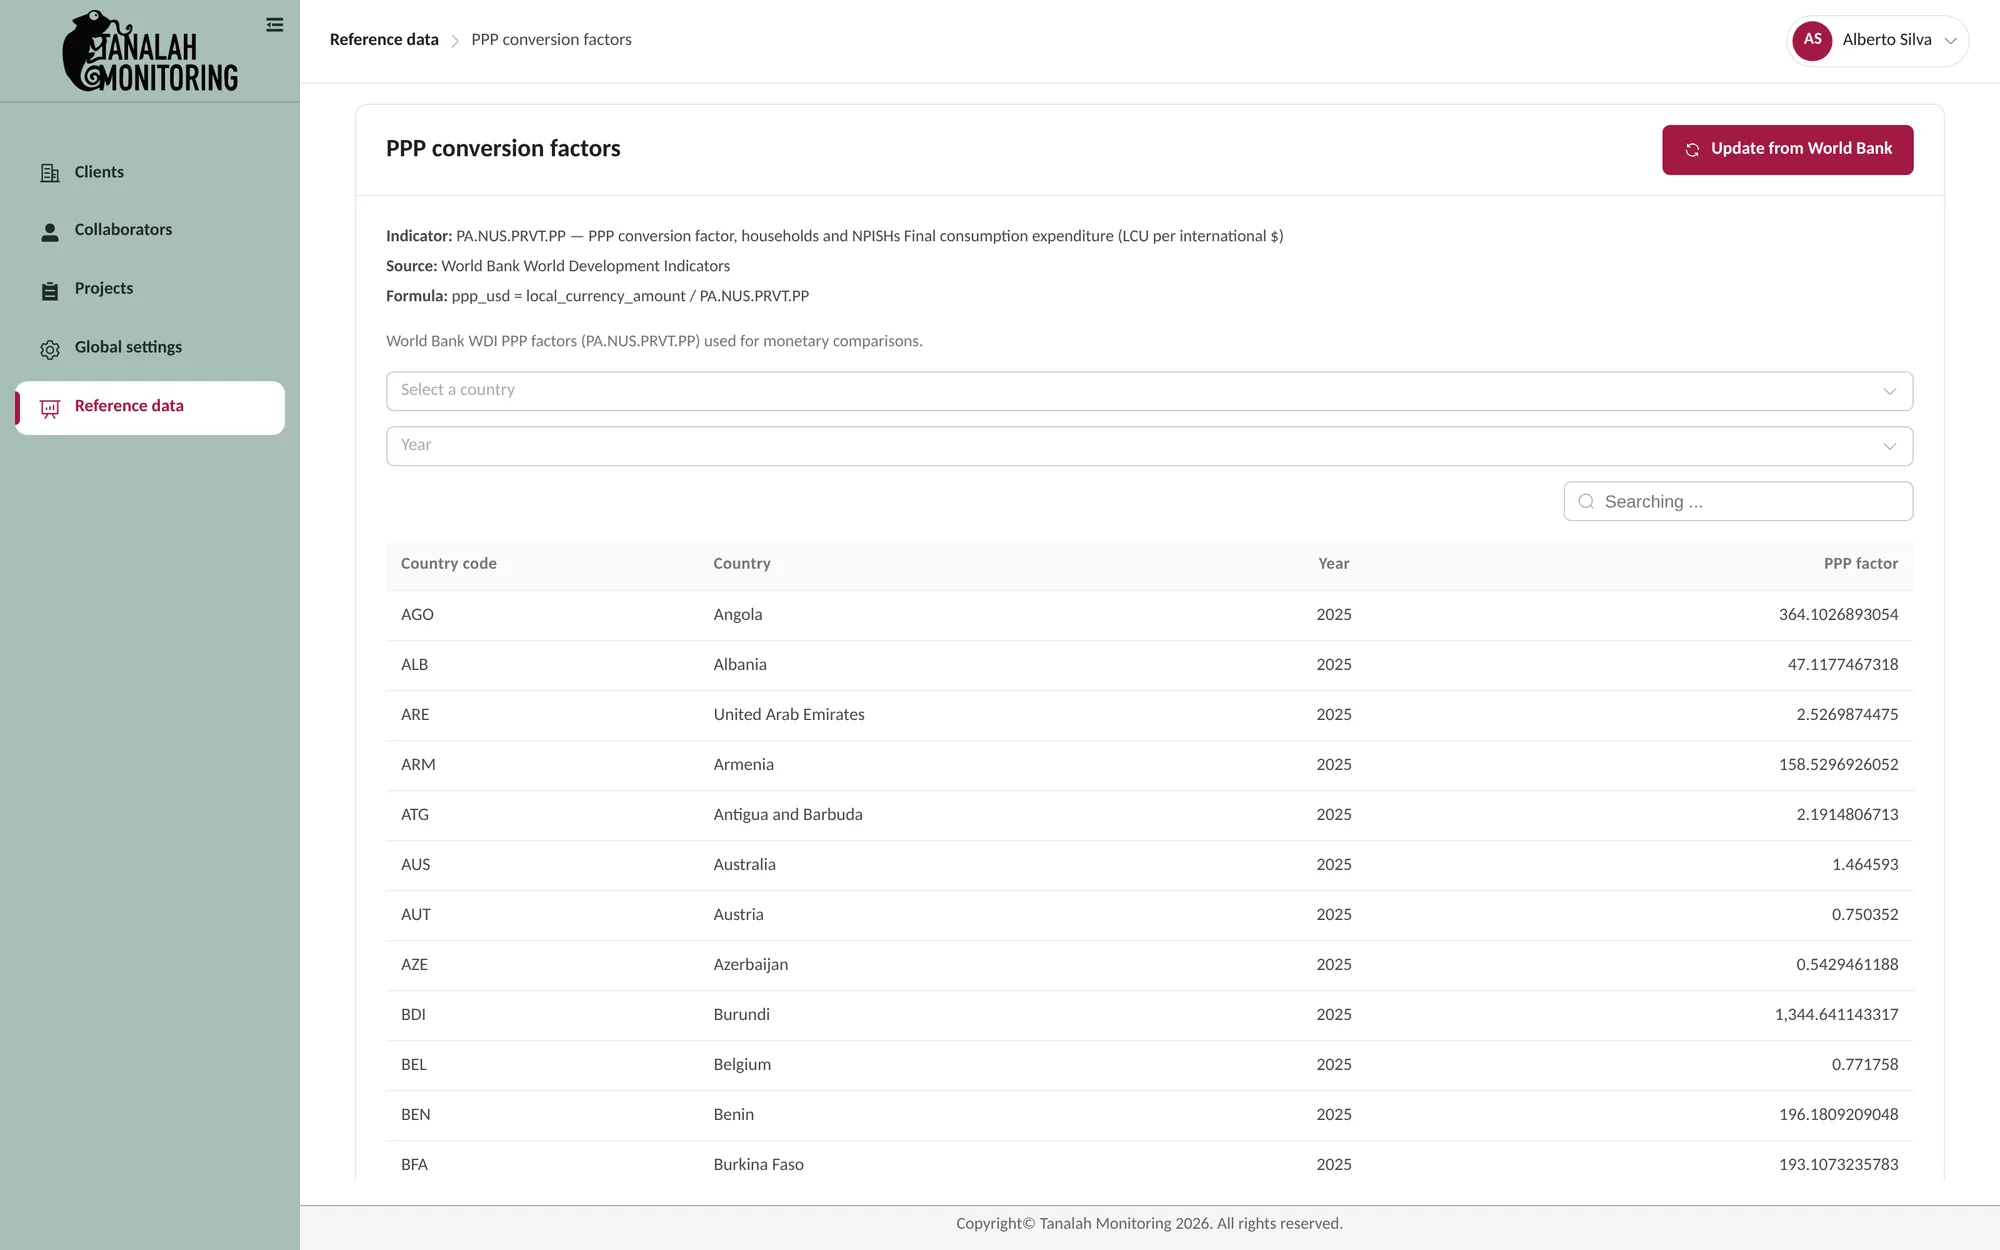
To compare surveys, you pick two or more and the platform lines up scores, criteria, context and sample. It warns when the surveys use different scoring versions or legal frameworks, because those scores don't read the same way. Amounts are converted to purchasing-power-parity dollars with World Bank factors, which the team refreshes from the platform. Every chart can be copied or downloaded, and a comparison exports to CSV or PDF.
-
01
Two profiles side by side
Men against women, younger against older, one region against another: the whole dashboard splits in two, with the score, the radar and every criterion for both groups.
-
02
The scoring has a version
Each survey stays tied to its scoring version. Comparing a v3 survey with a v4 one is possible, and the platform flags it.
-
03
The country's law as the benchmark
Income and working time are read against the country's legal minimums, set by country and by sector of activity.
-
04
Amounts comparable across countries
World Bank purchasing power parity factors turn ariary or CFA francs into one unit.
The project in pictures
8 images · Open any image to see it full size.



What Tanalah delivers today
Tanalah's clients open their project dashboard in English, French or Spanish and see the job quality of the people surveyed, dimension by dimension, without a spreadsheet. A longitudinal project adds one survey per wave and is compared with itself over time. The Tanalah team manages clients, collaborators, projects, country settings and reference data from the same platform.
The screens and video on this page come from a test environment with demo surveys.
- Score out of 10 by criterion, by dimension and overall
- Demographic filters and two-profile comparison
- Survey comparison with version and legal-framework warnings
- CSV and PDF export, interface in 3 languages
The questions we hear often
How do you measure the quality of a job?
With around 30 questions covering 6 dimensions: income, material conditions, working time, social protection, voice and representation, and satisfaction. Each criterion gets a score out of 10, and the scores roll up by dimension and into an overall score.
Does it work for informal employment?
Yes. The questionnaire adapts to each person's profile, whether employee, self-employed or informal, and data collection works offline.
Can you compare different countries?
Yes. Amounts are converted with World Bank purchasing power parity factors, and the platform warns when the compared surveys follow different legal frameworks or scoring versions.
Cases close to this one
 Read more
Remittance network · Colombia → Venezuela
From a legacy Web Forms app to an owned remittance platform
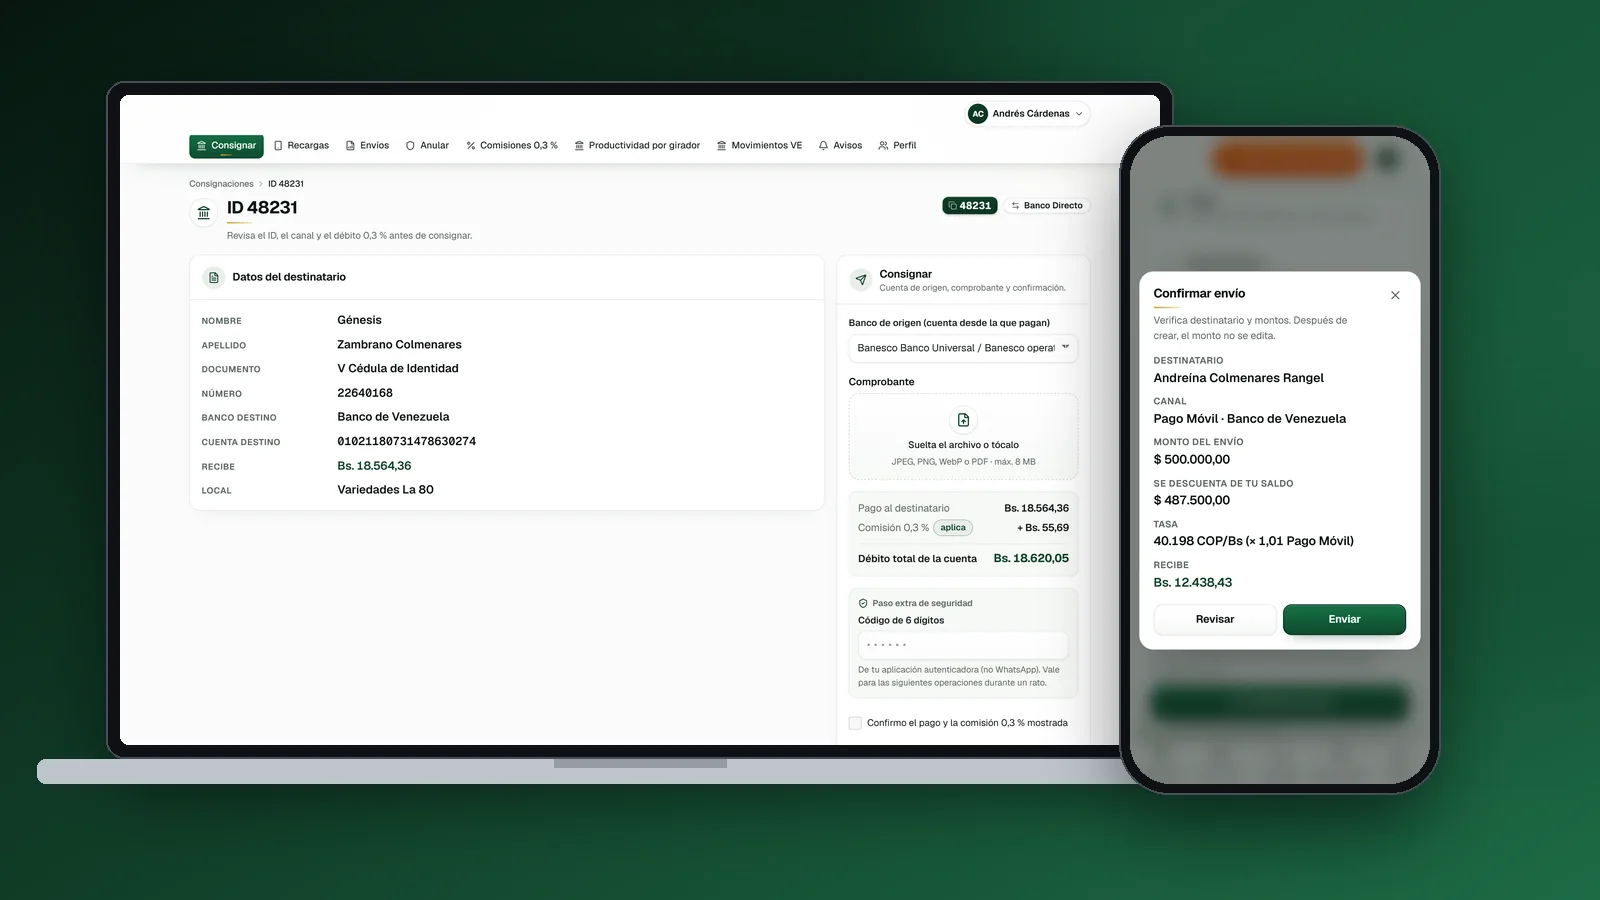
We replaced the ASP.NET system of a Colombia → Venezuela remittance network: 8 roles, mandatory MFA, every money movement in Postgres functions and 132 automated tests, in about six weeks.
Learn more → Read more
Rotary RM · Music publishing
Music publishing: catalogue, contracts and SACEM
Music-publishing platform for Rotary RM: catalogue, contract wizards, e-signatures, artist/label portals and a SACEM deposit assistant, out of spreadsheets and email.
Learn more →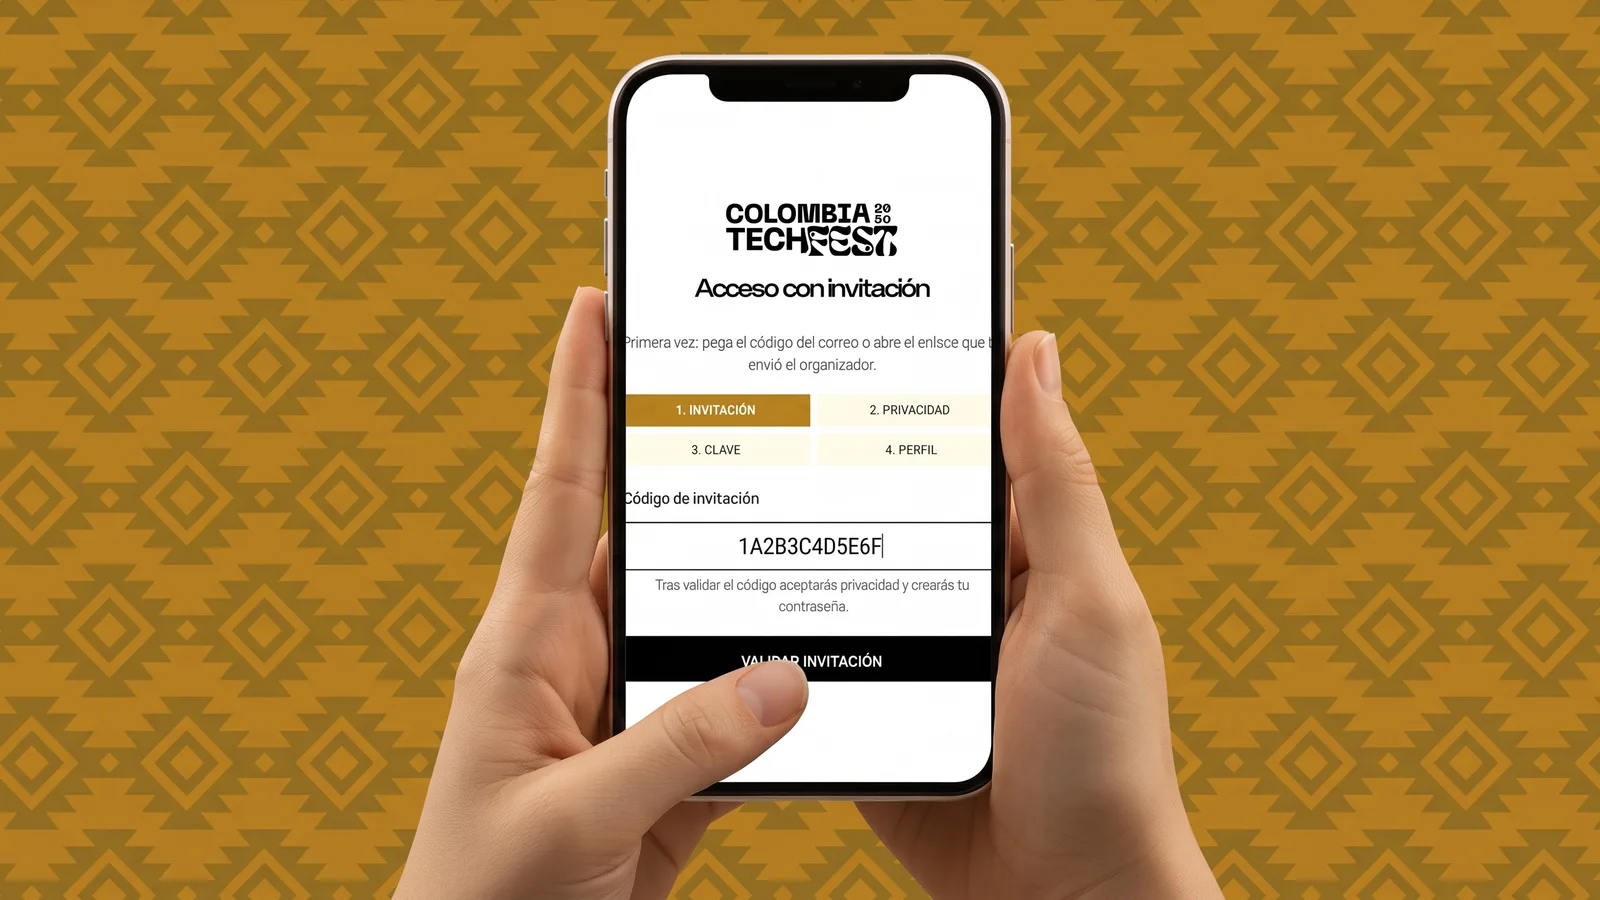 Read more
Colombia Tech Fest
The official tech festival app
Official Colombia Tech Fest attendee app: invite-only onboarding, live agenda, directory, 1:1 meetings, chat, offline maps and notifications, built for event-scale concurrency.
Learn more →Let's put it in production
Tell us your challenge. We reply within 24 business hours with an honest first read: if we can help, we'll say how; if not, we'll say who can.
I reply personally. No endless forms, no canned replies.