Governance
Catalogue, quality and access: who sees what and why it's trustworthy.
Pipelines that survive production, solid governance and clear dashboards: the pieces that turn data into decisions, with cost in plain sight.
Slash Digital Lab builds data and analytics solutions for companies, because imported data nobody queries isn't an asset: it's a cost. We build the full route (ingestion, quality, governance, dashboards) so any team decides with the right data in seconds. Observability, data contracts and cost control from the first sprint.
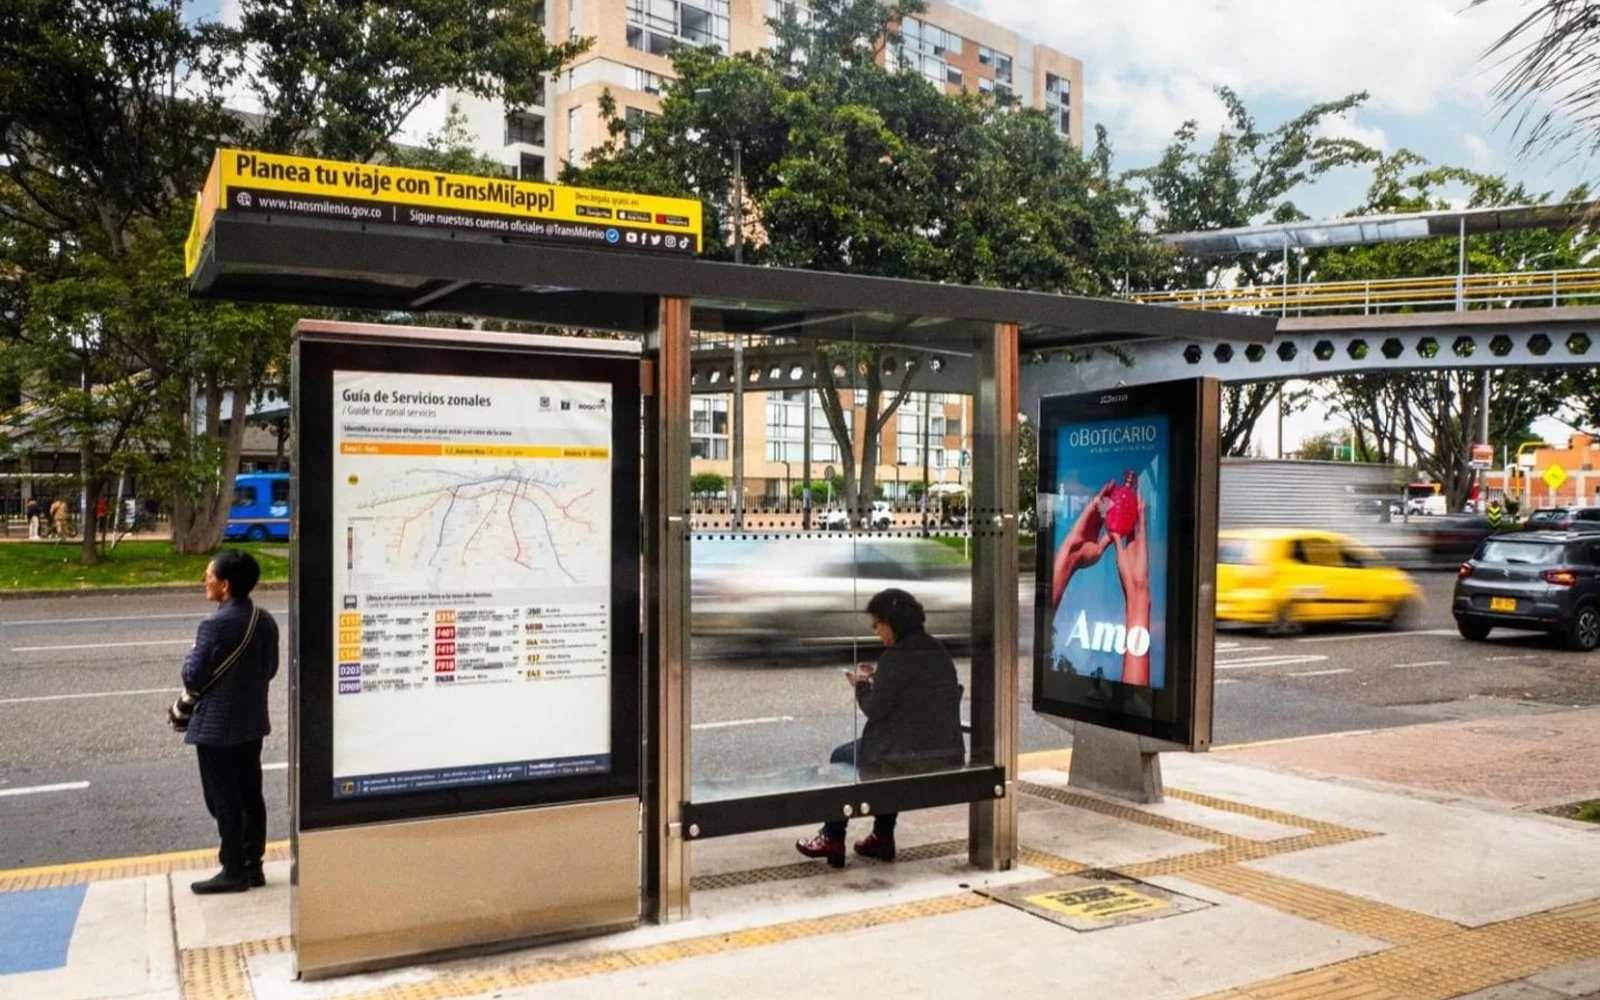
Case in production: the urban information platform for JCDecaux and Transmilenio distributes GPS, weather and air quality across 3,000+ screens in Bogotá. The same platform feeds internal systems and owned products; the repetitive work goes to process automation.
First the decision, then the dashboard. Never the other way around.
Catalogue, quality and access: who sees what and why it's trustworthy.
Secure pipelines and APIs to and from your systems.
Dashboards leadership actually opens, on mobile and desktop.
Natural-language questions with citations to the data that backs them.
What gets decided daily or weekly, and with which data today.
Connected sources, data contracts and quality alerts.
Single definitions agreed across teams.
Mobile dashboards, training and an improvement cycle.
| Governance | Catalogue, quality and access. |
|---|---|
| Integration | APIs, pipelines and batch. |
| Storage | Warehouse or lakehouse. |
| Observability | Freshness, volume and cost per source. |
| Visualisation | Mobile and desktop dashboards. |
| Security | Least privilege and auditability. |
| Languages | ES · EN · FR. |
 Read more
JCDecaux × Transmilenio
Read more
JCDecaux × Transmilenio
Urban information platform for JCDecaux and Transmilenio: GPS bus arrivals, weather and air quality across 3,000+ digital totems in Bogotá, with QR continuity to mobile.
Learn more →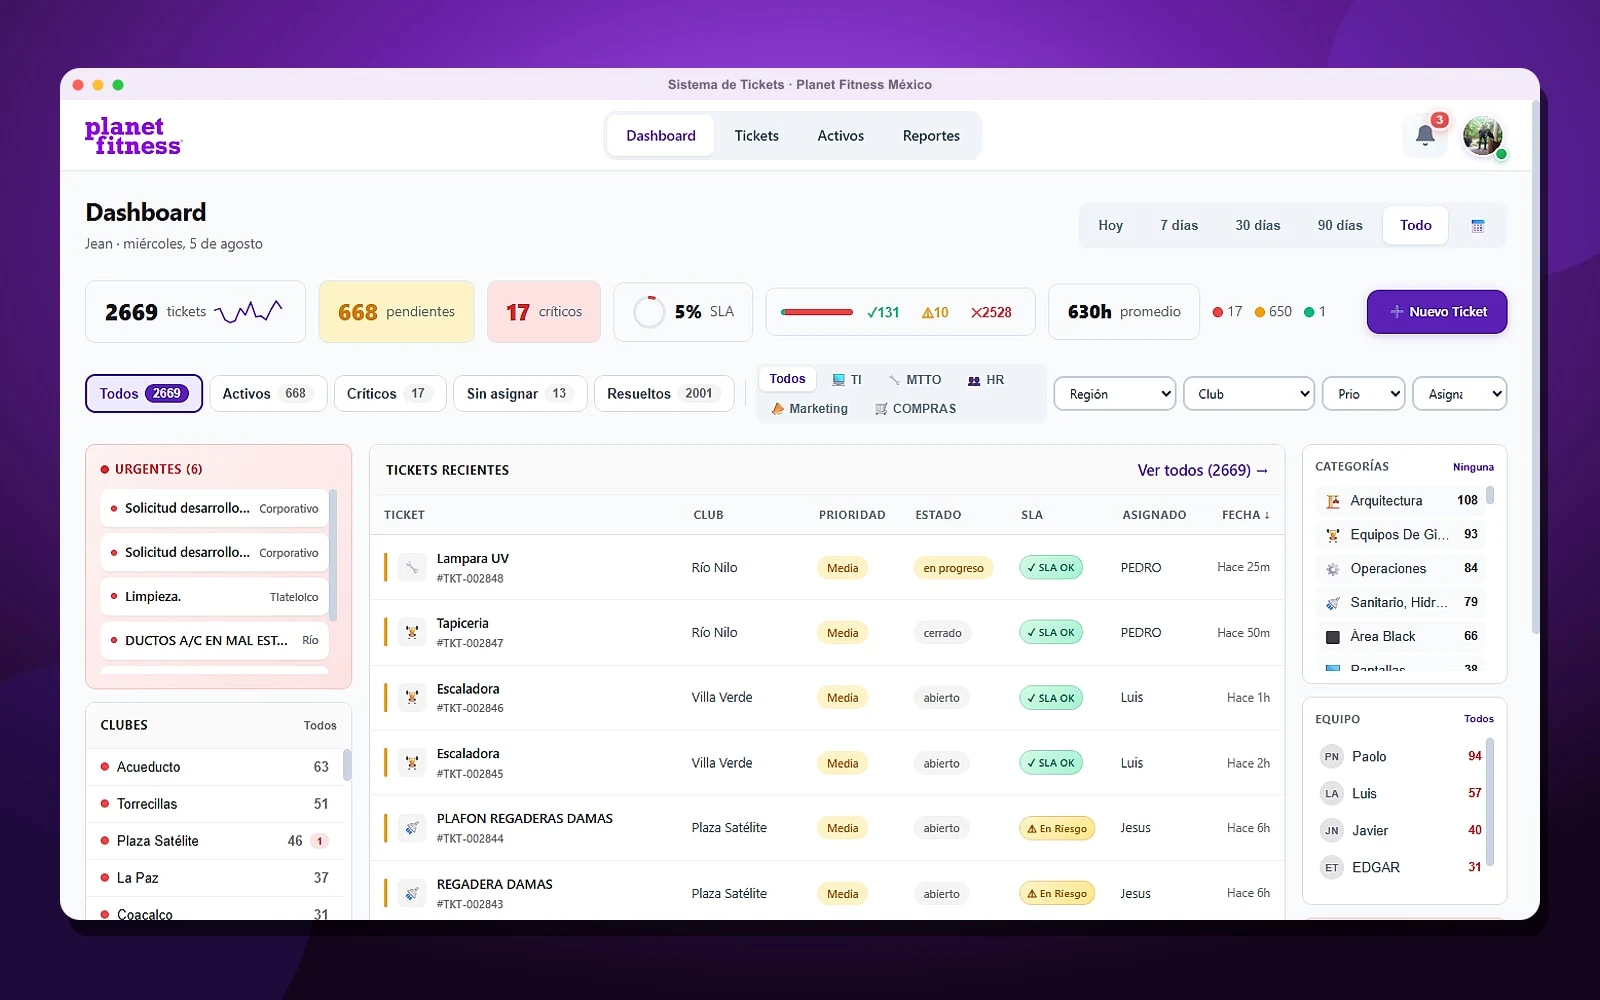 Read more
Planet Fitness Mexico
Read more
Planet Fitness Mexico
SaaS-exit program with Planet Fitness Mexico: we replaced ServiceDesk with owned multi-area ticketing, shipped PF Rooms (door tablets + Exchange) across CDMX, and we're building the next product to turn off another vertical license, with no paid seats.
Learn more →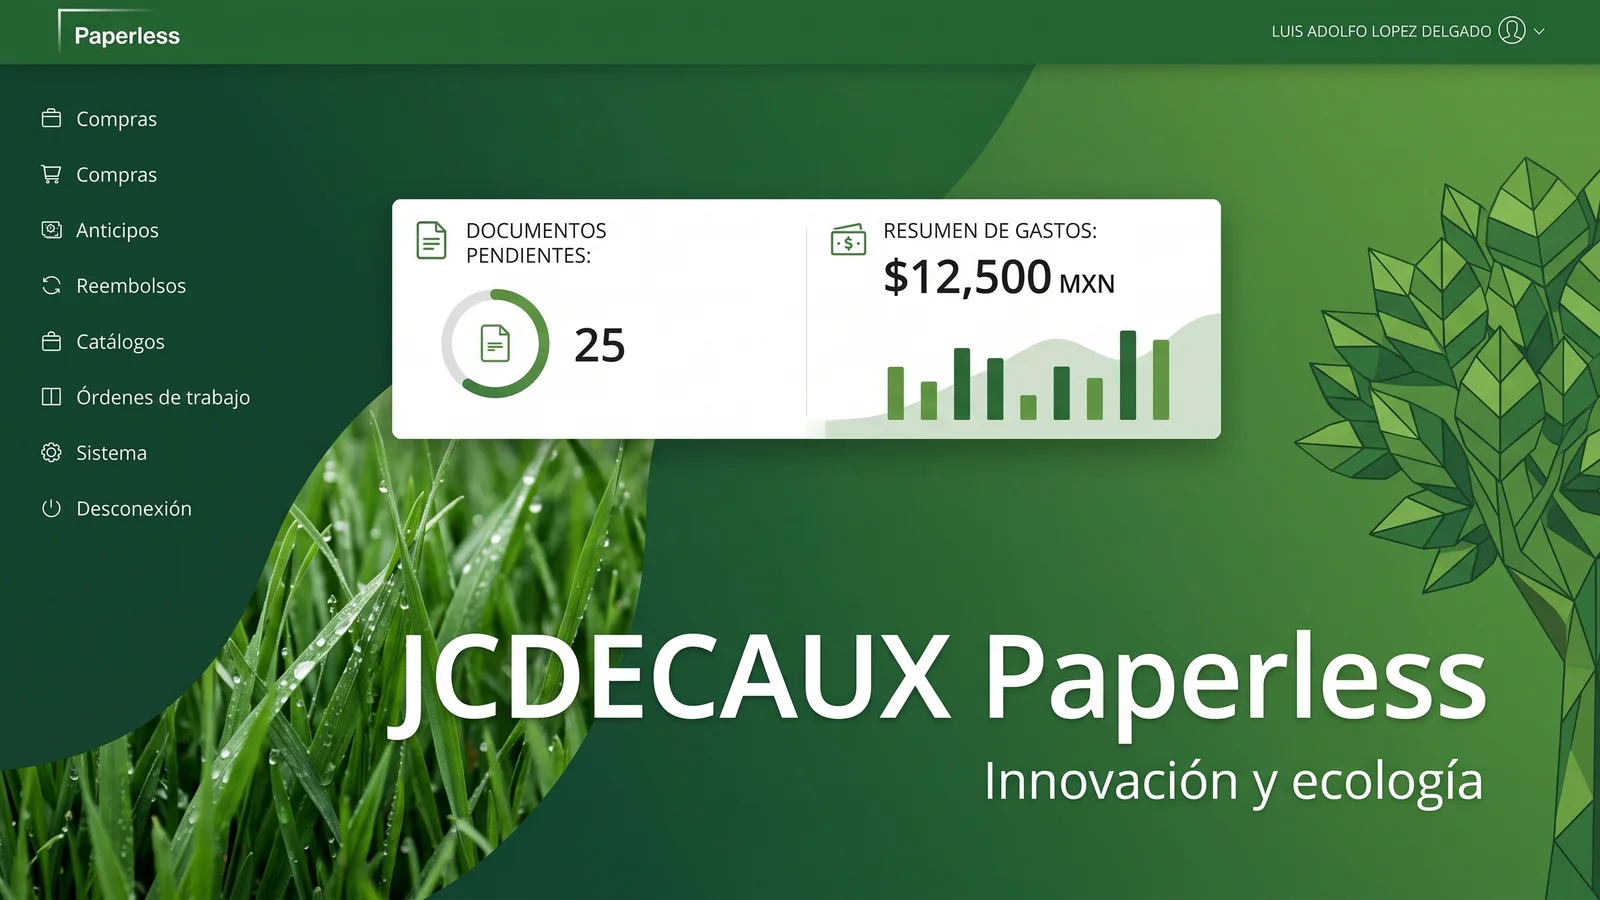 Read more
JCDecaux Mexico
Read more
JCDecaux Mexico
Paperless centralizes purchasing, inventory, work orders, advances and refunds for JCDecaux Mexico in an internal platform with Single Sign-On, approvals and audit-ready traceability.
Learn more →A data platform is a factory: nobody watching the line means defects ship. Documented architecture, alerts that wake someone up, and cost nobody discovers on the invoice.
Connected sources with schemas and breakage alerts.
Layered modeling with tests and documented lineage.
Freshness, volume and cost visible per source and per team.
An architecture built to grow without rebuilding everything.
We start with the decision you need to make; the dashboard comes after.
Yes, with access control and source traceability.
We choose per case: standard or open-source warehouse, ELT and BI; the decision is documented.
Yes: structure first, automate second, retire the critical spreadsheet last.
A first domain typically reaches production in 4–8 weeks.
It depends on how many sources need connecting and their quality, the volume and frequency of the data, and how many dashboards and users rely on it. We quote after a free first read.
Most cases resolve with well-operated standard architecture; big data comes later.
Yes: we run it together, or you hand us the platform.
Retention, access and minimisation defined by design.
Repetitive processes, out. Robust flows with traceability, in.
Learn more→ AIApplied AI for real operations: agents, RAG, vision, voice and automation.
Learn more→ SoftwareWe replace SaaS licenses with owned products your team controls.
Learn more→ WebProduction web platforms: fast, secure and built to scale.
Learn more→Tell us your challenge. We reply within 24 business hours with an honest first read: if we can help, we'll say how; if not, we'll say who can.
I reply personally. No endless forms, no canned replies.